Share
Follow Us
HEPATOLOGY, August 1998, p. 323-331, Vol. 28, No. 2
Original Articles
The Normal Adult Human Liver Biopsy: A Quantitative Reference Standard
Aleta R. Crawford1, Xi-Zhang Lin2, and James M. Crawford1
From the 1 Program in Gastrointestinal Pathology, Yale University School of Medicine and Yale Liver Center New Haven, CT; and the 2 Department of Medicine, National Cheng Kung University, Taiwan.
ABSTRACT
In assessing adult human liver histology, questions remain concerning the normal number of portal tracts and bile ducts in a liver biopsy. We therefore reviewed liver biopsies obtained with use of a percutaneous Menghini cutting needle (14G, internal diameter 1.6 mm), from 16 patients undergoing liver biopsy for screening procedures (age 49 ± 14 years, ±SD) and found to be normal by histological examination. The average aggregate length of the liver tissue was 1.8 ± 0.8 cm (area of 16.4 ± 10.7 mm2), representing 7 ± 3 tissue fragments. Portal triads containing at least one profile each of a portal vein, hepatic artery, and interlobular bile duct numbered 11 ± 6 per biopsy (range 3-23). Portal dyads, which did not contain one of these profiles, usually the portal vein, numbered 8 ± 5 (range 1-18). On a per-specimen basis, 38% of portal tracts did not contain a portal vein, 7% did not contain a bile duct, and 9% did not contain a hepatic artery. Because of multiplicity of profiles within portal tracts, however, the average number of profiles per portal tract was 6 ± 5 (range 2-35). Notably, on average there were 2.3 ± 2.2 interlobular bile ducts per portal tract, compared to 2.6 ± 2.3 hepatic arteries and 0.7 ± 0.7 portal veins. The average minimum external diameter of interlobular bile ducts was 13 ± 4 µm, of hepatic arteries 12 ± 5 µm, and of portal veins 35 ± 25 µm. Bile ducts greater than 30 µm in diameter were rare, only one each in two biopsies were observed. In contrast, probable canals of Hering were occasionally evident at the periphery of portal tracts (6 ± 6 per biopsy) and within the lobular parenchyma as strings of cuboidal cells (5 ± 5 per biopsy). We conclude that, although multiplicity of profiles is normal, portal dyads are almost as common as portal triads in normal peripheral liver tissue. On average, there are two interlobular bile ducts, two hepatic arteries, and one portal vein per portal tract, with 6 full portal triads per linear cm of tissue obtained by external Menghini biopsy technique with use of a 14G needle, equivalent to 0.8 ± 0.5 portal triads per mm2. By serving as a reference standard for adult human liver histology, these findings may assist in the histopathological assessment of liver biopsies, particularly those performed for disease conditions featuring loss of intrahepatic bile ducts. (HEPATOLOGY 1998; 28:323-331.)
INTRODUCTION
Histological evaluation of the liver by needle biopsy was first introduced in 1923,1and the advent of a rapid low-risk procedure2 enabled liver biopsy to become standard practice for assessment of liver disease. Diagnostic evaluation by pathologists is routinely qualitative or semiquantitative, yet the question frequently arises of what should be the normal complement of portal tracts and contained structures in a liver biopsy. A limited number of quantitative reports state that a percutaneous needle biopsy from an adult liver is likely to contain about 4 to 6 portal tracts,3 matched by an approximately equal number of terminal hepatic veins.4 Bile ducts have been noted to run parallel to hepatic arteries in portal tracts,5 with, on average, about 2 interlobular bile ducts per portal tract.6 Beyond these reports, however, there is little for the practicing pathologist to base evaluation of portal tract architecture on, save for a gestalt impression of the adequacy of liver biopsy, and a semiquantitative assessment of microarchitectural disruption.7-9
We therefore undertook a systematic review of liver histology in a series of normal adult human liver biopsy samples to generate a database for statistical analysis. Particular attention was paid to the overall length of the biopsy and the numbers and dimensions of portal tract structures. Contrary to expectations, we encountered an assortment of portal tracts which lacked one of the three portal tract profiles (bile duct, hepatic artery, or portal vein). These portal tract dyads were almost as frequent as the traditional portal triads; the average biopsy contained 8 portal dyads and 11 portal triads. An assortment of bile duct profiles also was encountered, including interlobular bile ducts running parallel to hepatic arteries and portal veins, and probable canals of Hering at the periphery of portal tracts and within the parenchyma. Our findings provide a rigorous database for assessment of abnormal liver histology and show a degree of architectural variability which heretofore has been underemphasized.
PATIENTS AND METHODS
Specimen Selection
A retrospective review of the surgical pathology records for Brigham and Women’s Hospital (Boston, MA) for the period 1988 to 1993 identified 23 percutaneous liver biopsy specimens reported with no diagnostic abnormalities. Review of these biopsies by an experienced hepatopathologist (James M. Crawford), without knowledge of clinical diagnoses or indications for biopsy, revealed three in which a mild portal tract inflammatory infiltrate was present. Hospital records for the remaining 20 patients were then revewed, with use of the absence of abnormal elevations in serum animotransferase values, alkaline phosphatase values, or bilirubin levels, and no serological evidence of hepatitis virus infection (with the tests having been performed) as criteria for inclusion. Four additional patients were excluded on the basis of these laboratory criteria, all because of minimal elevations in serum transaminases. The remaining 16 biopsies were then subjected to systematic review.
All liver biopsies had been obtained by a Menghini needle (14G, internal diameter 1.6 mm) from 16 patients (9 female age 58 ± 14 years, 7 male age 42 ± 9.7 years, aggregate ages 49 ± 14 years, ± SD). The indications for liver biopsy were as follows: evaluation for methotrexate toxicity in the early stages of treatment (10 patients; seven with rheumatoid arthritis, two with polymyositis, one with psoriasis), screening for genetic hemochromatosis (1 patient), needle biopsy following radiographic identification of common bile duct stones (1 patient), evaluation of a liver mass (1 patient), and evaluation of possible prednisolone toxicity (3 patients). In subsequent analysis, no differences in findings were encountered when comparing the biopsies from the 10 patients on methotrexate to the other 6 (data not shown). The 16 biopsies were therefore analyzed as a single population.
All specimens were fixed in formalin, embedded in paraffin, and sectioned by microtome with a thickness of 5 µm. Routine specimen processing involved staining slides with hematoxylin and eosin (15 levels), Masson trichrome (10 levels), and reticulin (5 levels), for a total of 30 levels per specimen. All levels were screened to ensure absence of histological abnormalities. One Masson trichrome-stained section from each biopsy, containing tissue that was of representative diameter and containing a minimum of folds or microtome chatter, was selected by light microscopy by a single individual (Aleta R. Crawford) for further review.
Morphometric Analysis
Each specimen was examined at ×100 magnification. A pen-and-ink map was drawn of the entire section, including major visual markings and the location, size, and shape of each area containing discernible collagen staining. After this initial scan, the slides were systematically examined at ×400 magnification with use of a Roche Imaging Microscope system (Roche, Research Triangle Park, NC). Images were captured by video camera and the dimensions of structures measured with use of a precision micrometer slide imaged under identical conditions as calibration. There were no differences in linear calibration for the x and y axes of the digitized images. Each section was scanned in its entirety to ensure that all identifiable profiles were measured, with use of the previously prepared map of each section as a guide.
Definitions
Although the portal tract is generally viewed as containing a portal vein, hepatic artery, and bile duct,10 portal tracts have at other times been defined by the presence of a portal vein and artery alone.3 The latter definition is a necessary step for studies of bile duct destructive diseases.5 The definition of an interlobular bile duct has required the presence of an accompanying portal vein6 or portal vein and hepatic artery.3 Alternatively, bile ducts have been defined as septal (>100 µm diameter) or interlobular (around 20 to 100 µm diameter), with cuboidal epithelial structures smaller than 15 to 20 µm in diameter designated as bile ductules.5,6,11 The terms bile ductules and cholangioles have in other instances been restricted to lumenal structures lined by a cuboidal epithelium at the periphery of portal tracts.3 The most rigorous definition of a canal of Hering is by electron microscopy, whereby cuboidal bile duct epithelial cells form a semilunar luminal structure with apposed hepatocytes12; the light microscopic definition of a canal of Hering is not rigorously established. Three-dimensional reconstruction may be the best technique for identifying canals of Hering by light microscopy,13but this was beyond the scope of our study.
So to provide a systematic description of the histological findings, preconceived definitions of portal tracts, bile ducts, bile ductules, and canals of Hering were kept to a minimum. The following definitions were used.
Portal Tracts. Portal tracts were defined as foci within the parenchyma containing connective tissue (by the Masson stain) and at least two luminal structures embedded in the connective tissue mesenchyme, each with a continuous connective tissue circumference. Foci with only one luminal structure were designated as solitary profiles of that interlobular bile duct structure. A portal tract containing at least one profile of a portal vein, hepatic artery, and BD1 was designated as a triad. A portal tract containing only two of these classes of profiles (but potentially multiple representatives of the same class) was designated as a dyad, after the Greek dyo for two.
Terminal Hepatic Veins. Terminal hepatic veins were distinguished from portal tracts and solitary profiles by the presence of a luminal endothelium-lined vascular structure, surrounded by a delicate discontinuous connective tissue sheath, with the lumen in continuity with multiple sinusoidal spaces.
Portal Vein Profiles. Portal vein profiles were identified by the presence of blue collagen staining of a thin, continuous connective tissue sheath, with or without scattered smooth muscle cells, around an endothelium-lined luminal space sometimes containing red blood cells. The maximum external dimension encompassed the exterior of the blue stained rim, measured across the greatest possible distance. The minimum external dimension was measured in the transverse (orthogonal) axis, at the point of maximum caliber. The maximal transverse axis was used to minimize artefact introduced by oblique or tangential sectioning in a manner similar to the use of maximum encompassed circles to determine external diameter.4 Lymphatic channels, which were not measured in this study, were endothelium-lined channels not surrounded by a uniform thin connective tissue sheath.
Hepatic Artery Profiles. Hepatic artery profiles were identified by the presence of a whorl of blue stained collagen with interspersed smooth muscle cells (tunica media), surrounding an endothelium-lined luminal space. The maximum external diameter was measured from the exterior aspect of the tunica media across the greatest possible distance,5 and the minimum external diameter was measured in the transverse direction at the point of maximum caliber.
Bile Duct Profiles. Bile duct profiles were identified by a cross section of cuboidal epithelial cells in a circular or ellipsoid configuration with an open lumen and a continuous connective tissue sheath, and were designated BD1. Maximum external diameter was measured across the greatest distance from the outer aspect of the subepithelial basement membrane5; minimum external diameter was measured in the transverse direction at the point of maximum caliber. Note was made when the bile duct profile was in direct apposition with hepatocytes; partial bile duct profiles directly apposed to hepatocytes at the interface of the portal tract with the hepatocellular parenchyma, with a basement membrane underlying only the cuboidal epithelium-lined portion, were designated BD2 and represent probable canals of Hering. Single bile duct profiles cut in cross-section with a clear lumen but unaccompanied by portal vein or hepatic artery were counted as solitary bile ducts. Longitudinal strings of two or more cuboidal cells within the parenchyma without or with a lumen, unaccompanied by vascular structures or a connective tissue sheath, were designated as cuboidal strings. While distinction between solitary bile ducts and cuboidal strings may be somewhat arbritrary, the more encompassing latter definition allowed for scoring of an array of cuboidal epithelial structures not easily classifiable as bile ducts per se. Immunohistochemical staining (as with cytokeratin 19,14) for identification of bile ducts was not used for the morphometric measurements, because we wished to analyze liver biopsies as would be encountered during routine histological evaluation. Supplemental staining with cytokeratin-19 on a subset of biopsies (not shown) confirmed the presence of solitary bile ducts and cuboidal strings within the parenchyma, as previously reported.13
Number of Tissue Fragments. The number of tissue fragments was based on tissue fragmentation evidenced by complete separation of tissue pieces, which could not be attributed to sectioning artefact on the basis of a jigsaw puzzle-like match of adjacent pieces. Partial tears in a biopsy were defined as partial separation of the tissue, without a jigsaw puzzle-like match between the opposing tissue faces that could be attributed to sectioning artefact. This latter finding was quantified because of the propensity of such tears to occur in the centrilobular region of the lobule, a finding which we are unaware of being previously reported.
Total Specimen Surface Area. Total specimen surface area was estimated by measuring the aggregate tissue length with a standard ruler marked in millimeters, measuring the maximum specimen width with the calibrated digital microscope, and multiplying length and width.15
Parallelism. Parallelism between bile ducts and hepatic arteries was defined as the ratio of BD1 in portal tracts also containing a hepatic artery, divided by the total number of BD1. Parallelism between hepatic arteries and bile ducts was defined as the converse, namely hepatic arteries in portal tracts also containing a BD1 divided by the total number of hepatic arteries. This definition of parallelism is slightly modified from that used by Nakanuma and Ohta,5 in which parallelism was subdivided on the basis of hepatic artery size ranges. A similar definition was used for parallelism of portal tracts with bile ducts or hepatic arteries, and vice versa. As with Nakanuma and Ohta,5 this concept of parallelism does not denote a geometric relationship between profiles, but rather is a measure of the frequency of coexistence of two classes of profiles. Pairings of bile ducts with hepatic arteries were made when these structures were in the same portal tract and within 100 µm of each other, thus denoting a more specific geometric relationship. This definition is slightly more lenient than that used by Nakanuma and Ohta,5 in which a bile duct-hepatic artery pair was defined as a bile duct within three times the distance of the hepatic artery external diameter. Given the small size of hepatic arteries observed in the current study, many pairings would have failed to meet the definition of Nakanuma and Ohta. As with Nakanuma and Ohta, rank-ordering of pairings by diameter was used in our analysis, when multiple profiles of bile ducts and hepatic arteries were present in the same portal tract.
Statistics
Data were compiled in three ways: (1) on the basis of structural profiles per biopsy, (2) on the basis of structural profiles per portal tract, and (3) as an aggregate population of individual structural profiles. In each instance, mean values ± SD were computed, as were the 95% confidence intervals. Correlations and statistical comparisons were made with use of Pearson Product Moment coefficients and analysis of variance, respectively.
RESULTS
table 1 describes the findings for biopsy outcome. The average aggregate length of the tissue biopsy cores was 1.8 cm, which compares favorably to the 1.5 to 2.0 cm length specimens obtained in the initial report of this rapid biopsy technique by Menghini.2 As with virtually every parameter measured in this study, the range of tissue lengths was considerable. The measured core width, 0.9 mm, was less than the nominal 1.6 mm internal diameter of the biopsy needle. The reduction in diameter is similar to that observed in the initial report by Menghini, in which a 1.5-mm-diameter needle generated tissue cores 3/4 mm-wide.2 Fragmentation was a routine event because no biopsy consisted of a single piece of tissue, and there were as many as 13 fragments of tissue. Partial tears in the specimen cores were observed an average of nine times in each biopsy specimen. By far the majority of such tears were in the vicinity of terminal hepatic veins located at the edges of the tissue core. While this geographic tendency of tears is an incidental finding, we include these data because they may reflect a relative resistance of the periportal regions of the liver to the mechanical stress of the bioptic procedure.
| View This table | table 1. Dimensions and Fragments of Liver Biopsies (n = 16) |
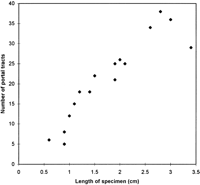
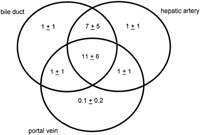
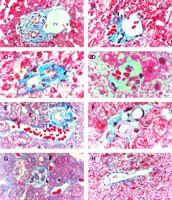
There were an average of 21 portal tracts per specimen, and the number of portal tracts correlated well with the aggregate length of the tissue core biopsy (Fig. 1). The composition of these portal tracts is shown in the Venn diagram of Fig. 2, and the range and 95% confidence limits for these data are shown in table 2. Per specimen, on average only 11 portal tracts contained the traditional triad of portal vein, hepatic artery, and bile duct (Fig. 3A and B). Bile duct profiles with a hepatic artery and no portal vein (Fig. 3C) occurred at a rate of 7 per specimen. Bile duct profiles with a portal vein only (Fig. 3D), hepatic arteries with portal vein only (Fig. 3E), two or more hepatic arteries only (Fig. 3F), and two or more BD1s only all were unusual, each occuring at rates of about 1 per specimen. Only one portal tract with portal veins only was identified, and this was at the edge of a tissue section (not shown). Solitary bile ducts (Fig. 3G), not counted as a portal tract, were encountered at a rate of 4 per specimen. Collectively, these results support the concept of variable compound lobular architecture as described in porcine liver by Ekataksin et al.,16 in which bile ducts and hepatic arteries without companion portal veins are observed more frequently in the periphery of the liver. Lastly, terminal hepatic venules were observed without difficulty (Fig. 3H). There were 7 terminal hepatic veins per specimen, the same as the 7 per Menghini needle biopsy specimen reported by Caulet et al.4
|
Fig. 1. Correlation of aggregate length of the core tissue biopsy with the number of portal tracts. The Pearson Product Moment Correlation statistic was 0.920 (P < .00001). |
|
Fig. 2. Venn diagram depicting the number of portal tracts per biopsy containing bile ducts (BD1), hepatic arteries, and portal veins. As portal tracts were defined as having at least two profiles (see Methods), portal tracts with bile ducts, hepatic arteries, or portal veins alone contained at least two of these classes of structures. This diagram depicts only the distribution of bile ducts (BD1) within portal tracts, and does not include the distribution of probable canals of Hering (BD2) profiles (see Patients and Methods for definitions). |
| View This table | table 2. Number of Portal Tracts, Terminal Hepatic Veins, and Solitary Bile Duct Profiles or Cuboidal Strings of Cells per Biopsy |
|
Fig. 3. Portal tract profiles (A) Conventional portal triad, containing 1 bile duct (BD1, arrowhead), 3 hepatic arteries (*; top right, middle, and lower left), 1 portal vein, and 1 probable canal of Hering (BD2,arrow). (B) Conventional portal triad containing 1 bile duct, 1 hepatic artery, and 3 portal veins. Portal tracts with: (C) bile duct (BD1) and hepatic artery; (D) bile duct (BD1) and portal vein; and (E) hepatic artery and portal vein. (F) Portal tract with two hepatic arteries. (G) Solitary bile duct (BD1). (H) Terminal hepatic vein. (Original magnifications: [A,H] ×400, bar = 20 µm; [B-G]: ×1,000, bar = 10 µm.) |
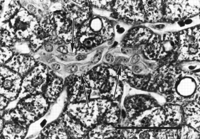
A spectrum of bile duct profiles was observed. In addition to the bile ducts completely surrounded by a connective tissue sheath and within a portal tract (BD1, see Fig. 3A), partial bile duct profiles at the periphery of portal tracts (BD2, see Fig. 3A), and occasional cross-sections of solitary bile ducts (Fig. 3G), we observed longitudinally-cut groups of cuboidal cells embedded within the parenchyma, without or with visible lumina (cuboidal strings, Fig. 4). There were about 4 solitary bile ducts and 5 cuboidal string profiles per specimen (table 2), and their location bore no readily discernible lobular relationship to portal tracts.
|
Fig. 4. Cuboidal string within the parenchyma (outlined by arrows), containing a lumen but lacking a continuous connective tissue sheath. (Original magnification ×1,000, bar = 30 µm.) |
Findings on the basis of portal tracts are reported in table 3. On average, BD1 and hepatic artery profiles were multiple, with 2.3 bile ducts and 2.6 hepatic arteries per portal tract. The average number of portal veins per portal tract was less than unity (0.7). Profiles designated BD2 (probable canals of Hering) occurred at the rate of 0.4 per portal tract. Notably, there were on average 6.5 total profiles per portal tract.
| View This table | table 3. Number of Interlobular Bile Ducts (BD1), Hepatic Arteries, Portal Veins, and Canals of Hering (BD2) per Portal Tract |
The rates of parallelism between portal tract structures (see Methods) are shown in table 4. Most bile ducts (BD1, 92%) ran in parallel with hepatic arteries, and most hepatic arteries (96%) ran in parallel with bile ducts. These values are higher than the 70% to 80% rates of parallelism described by Nakanuma and Ohta for normal tissue.5 Portal veins also tended to run in parallel with a nearby bile duct (95% of the time) and hepatic artery (93% of the time), but the converse was not true. Bile duct and hepatic artery profiles were accompanied by a portal vein only 72% of the time. On a per-specimen basis, 38% of portal tracts did not contain a portal vein, 7% did not contain a bile duct, and 9% did not contain a hepatic artery.
| View This table | table 4. Parallelism of Structural Profiles Within Portal Tracts |
These data indicate that a portal tract is best viewed as a variable structure in which portal veins tend to be accompanied by hepatic arteries and bile ducts, but with frequent deviation from this grouping. Notably, portal dyads with only two of the structural components of a portal tract are almost as frequent as triads. The presence of occasional solitary hepatic arteries and bile ducts also attests to this variability in structure. This finding was confirmed by examining the 3-dimensional anatomy of one dyad in each liver biopsy through all tissue levels. Scoring interlobular bile ducts, hepatic arteries, or portal veins as present or absent, we found that of the 16 dyads examined six remained as such through all 30 levels, six acquired the third member to become triads, one lost a member to become a monad (after Greek, monos), and three dissipated into the parenchyma. These data indicate that we are observing the terminal branches of the portal tract system. The data do not support the position that we are merely observing tangential sections of only triads.
The minimum external diameters of portal tract profiles and terminal hepatic vein profiles are presented in table 5 (the maximal external diameters exhibited a wide range and are not likely to be useful data, given the variability in angle of sectioning). Hepatic arteries and bile duct profiles exhibited similar minimum diameters of about 12 µm on average, whereas portal vein profiles were three times greater in minimum diameter. There were no differences in the minimum diameters of hepatic arteries, bile ducts, or portal veins contained within triads or dyads, also suggesting that essentially all of the portal tracts observed were at the periphery of the portal tract system. The partial bile duct profiles at the portal tract interface (probable canals of Hering, BD2) exhibited calibers of 11 µm, not significantly less than the BD1 bile duct profiles. Not surprisingly, the smallest structures were the cuboidal strings within the parenchyma, which exhibited minimum dimensions of 10 µm. Terminal hepatic veins exhibited minimum external diameters of 67 µm, larger than the 18 ± 4 µm reported by Caulet et al.4Computation of the caulet values may merit reconsideration, however, because hepatocyte diameters are ~6 µm when computed on the basis of their published photomicrographs, considerably less than the diameters of 18 µm reported elsewhere.17
| View This table | table 5. Dimensions of Tissue Profiles |
The ratio of minimum external diameter for paired bile ducts-to-hepatic arteries was 1.18 ± 0.44 with a Pearson coefficient ratio of 0.155 (P < .0001, see Methods), the inverse of the 0.7 to 0.8 ratio reported by Nakanuma and Ohta.5 If the diameter ratio was made by a rank order method, in which the largest diameter bile duct in any given portal tract was compared to the largest diameter hepatic artery within 100 µm, next largest with next largest, and so on,5 the bile duct-to-hepatic artery diameter ratio was 1.13 ± 0.37, with a Pearson coefficient ratio of 0.385 (P< .0001). Clearly, the minor variations in correlation figures are dependent on the methods used for matching portal tract profiles one with another.
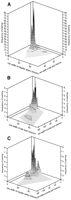
The size distributions and correlations between minimum external diameters for rank ordered, paired profiles of bile ducts (BD1 only), hepatic arteries, and portal veins within portal tracts are shown graphically in Fig. 5. The dimensions of all paired profiles were positively correlated, but the correlations were not tight ones. Nevertheless, the diameter of a hepatic artery was the best predictor of the diameter of its companion bile duct.
|
|
Fig. 5. Minimum external diameters of portal tract profiles, plotted as frequency distributions of the size correlations of: (A) hepatic arteries versus bile ducts (BD1); (B) bile ducts versus portal veins; and (C) hepatic arteries versus portal veins. The Pearson Product Moment Correlations were: hepatic artery versus bile duct (BD1), P= .385, P < .0001; bile duct (BD1) versus portal vein, P = .562, P < .0001; and hepatic artery versus portal vein, P = .310, P< .0001. |
DISCUSSION
Liver microarchitecture is generally schematized as a composite of hexagonal and pentagonal lobular units containing traditional portal triads; liver acini are subsumed in lobular structure as the smaller triangular physiological units.10However, liver architecture is not homogeneous,16 but rather exhibits a variability more characteristic of fractal geometry.18 Microarchitectural variability at the liver periphery is greater than at deeper sites within the liver.16 Thus, an assumption that all normal portal tracts should contain a portal vein, hepatic artery, and bile duct does not appear to be valid.
Percutaneous needle biopsy is a standard technique for sampling liver tissue. All biopsies present the pathologist with the basic question of what is normal, particularly because no one sampling method can be both representative and minimally invasive. We conducted this study to establish the apparent range of normality in percutaneous liver biopsies from the adult human. The average core tissue biopsy 1.8 cm in length contained 21 portal tracts and 7 terminal hepatic veins. These numbers are consistent with the view that the diameter of a lobule in a normal human liver is 0.8 to 1.5 mm.19 The fact that there were more portal tract structures than terminal hepatic venules suggests that there is a more complex pattern of portal tract ramification than collecting venules, particularly because our definition of a portal tract was encompassing rather than restrictive. Despite the inclusive nature of our definition, we found that the average portal tract contained 2 bile ducts, 2 hepatic arteries, and slightly less than 1 portal vein. Of these portal tracts, 11 were portal triads and 8 were portal dyads, with scattered isolated hepatic arteries and bile ducts. Hepatic arteries and bile ducts generally accompanied each other, and hepatic artery diameters approximated those of bile ducts. Our findings support the position that the numerical correlation of hepatic arterial profiles with bile duct profiles is a good indicator of bile duct preservation or loss.5 Our findings also support the concept5 that the size of a bile duct relative to its companion hepatic artery permits assessment of whether a bile duct is undergoing destruction (a withered bile duct with reduction in diameter) or hyperplasia (with an increase in diameter).
The diameters of hepatic arteries and BD1 described in this study are smaller than those reported in previous morphometrical studies of human liver tissue. However, such studies have almost exclusively used wedge biopsy or autopsy material,3,5,20 and therefore were based on a more extensive sample of liver tissue including tissue closer to the porta hepatis. Although portal tracts containing interlobular bile ducts up to 100 µm in diameter may extend well out towards the periphery of the liver,3 our findings indicate that most peripheral portal tracts are much smaller, with hepatic artery and bile duct profiles routinely extending down to the 10- to 15-µm-diameter size range. A corrollary of our findings with percutaneous sampling of peripheral liver tissue is that we observed a roughly 1 to 1 relationship between these small hepatic arteries and interlobular bile ducts. This is at variance with the recent report of Washington et al.,20 which was based on autopsy material and included larger bile ducts having up to four associated hepatic arteries. A further consideration with this study is that we examined one tissue level only for morphometric analysis. As exhaustive measurement and analysis of each tissue section took two to three days’ work, morphometric assessment of multiple levels per specimen was not a practical possibility. Our nonmorphometric analysis of the evolution of dyads through all 30 levels in each biopsy indicates that portal tract architecture may indeed evolve through the multiple levels in any given biopsy. Nevertheless, we submit that assessment of portal tract architecture by a pathologist ultimately involves forming a composite impression of the tissue as a liver sample with a given number of portal tracts. As such, our data provide quantitative information about portal tracts that may serve as a basis for comparison to liver tissue affected by a disease process. For example, our findings support the recent report by Demetris et al.,21in which liver biopsies from patients with chronic liver allograft rejection showed an average of 9.1 ± 4.1 portal tracts per specimen, 4.1 ± 2.6 of which were without bile ducts. The absence of bile ducts in 55% of portal tracts is clearly different than the absence of bile ducts in only 7% of normal portal tracts documented in the current study. Our findings also provide a reference point for reports of idiopathic adulthood biliary ductopenia,9 including a recent report in which only 62% ± 7% of portal tracts contained bile ducts.22
Our observations of bile duct profiles both at the periphery of portal tracts (BD2) and within the parenchyma (solitary bile ducts and cuboidal strings) may have pathobiological significance. In the absence of any obstruction to bile flow or necroinflammatory process in these patients, it seems inappropriate to designate these structures as proliferating or metaplastic bile ductules.6 Rather, the BD2 profiles and those within the parenchyma all are consistent with previous histological descriptions of canals of Hering in normal liver,3,6 recognizing that canals of Hering are most easily identified by electron microscopy.12 Our data runs contrary to the general perception that canals of Hering are inapparent by routine histological analysis of liver tissue and that there are few bile ductules visible in sections of normal livers,11 although we recognize that extreme care was required to identify these structures in the current study. With regards to the intraparenchymal ductular structures, the possibility that canals of Hering may extend beyond the interface of portal tract and hepatocellular parenchyma well into the lobule was raised years ago3 and has been supported by recent three-dimensional reconstruction of liver tissue using immunohistochemical staining with CK-19 as a way of highlighting bile ductular structures.13 Our data also suggest that canals of Hering extend some distance into the parenchyma, not unlike the ramifications of portal venules and hepatic arterioles.23,24 Indeed, this most peripheral population of ductular cells may represent the anatomic compartment from which the smallest bile duct epithelial cells are obtained in isolated mammalian liver preparations.25 These ductular cells may also correspond anatomically to the terminal branches of the biliary tree beyond the level of interlobular bile ducts, recently documented by three-dimensional reconstruction of the normal human liver.26 Given recent evidence that hepatic regeneration and carcinogenesis may be based on parenchymal progenitor cells intermediate in phenotype between hepatocytes and bile duct epithelial cells,27 there may be great value in determining the behavior of these small bile ductular structures within the lobule in human disease conditions.
In conclusion, this study provides a detailed statistical analysis of normal adult human liver tissue sampled by percutaneous needle biopsy. Recognizing that histopathological assessment of the liver is ultimately a qualitative exercise, we nevertheless hope that this database will provide grounds on which to make semiquantitative or quantitative statements about hepatic microarchitecture. At the very least, recognition of the variability in portal tract structure provides a measure of reassurance when variant portal tracts are encountered in biopsies performed to evaluate graft rejection in liver transplantation, graft-versus-host disease, paucity of bile duct syndromes, and necroinflammatory bile duct destructive diseases. Second, our detailed documentation of the normal state may assist in future studies of the hepatic response to injury. Finally, our findings provide quantitative support for a pathologist’s statement to the physician performing a needle biopsy that the number of portal tracts in the liver biopsy is directly proportional to the length of tissue core obtained.
Footnotes
Acknowledgement: This study was prompted in part by questions raised at the 1994 meeting of the International Liver Pathology Study Group on Bile Duct Diseases, in Verona, Italy. Thanks are given to the members of that group for providing such impetus. They are: Charles Balabaud, Bordeaux, France; Krzyzstof Bardadin, Warsaw, Poland; Paulette Bioulac-Sage, Bordeaux, France; Romano Colombari, Verona, Italy; (James M. Crawford, New Haven, CT); Amar Paul Dhillon, London, England; Linda D. Ferrell, San Francisco, CA; Yasuni Nakanuma, Kanazawa, Japan; Bernard Portmann, London, England; Jurgen Rode, Darwin, Australia; Peter J. Scheuer, London, England; Dale Snover, Minneapolis, MN; Neil Theise, New York, NY; Swan Thung, New York, NY; Wilson Tsui, Hong Kong; and Dirk van Leeuwen, Birmingham, AL. Special thanks are given to Dr. Neil Theise, for ongoing critical discussions of normal human liver anatomy.
Abbreviations: BD1, interlobular bile duct; BD2, canal of Hering.
Supported in part by NIH grant DK39512.
Presented in abstract form at the 1997 meeting of the American Society for the Study of Liver Diseases, Chicago, IL
Received December 2, 1997; accepted March 3, 1998.
Address reprint requests to: James M. Crawford, M.D., Ph.D., Department of Pathology, Yale University School of Medicine, 310 Cedar Street, P.O. Box 208023, New Haven, CT 06520-8023. Fax: (203) 737-1064.